
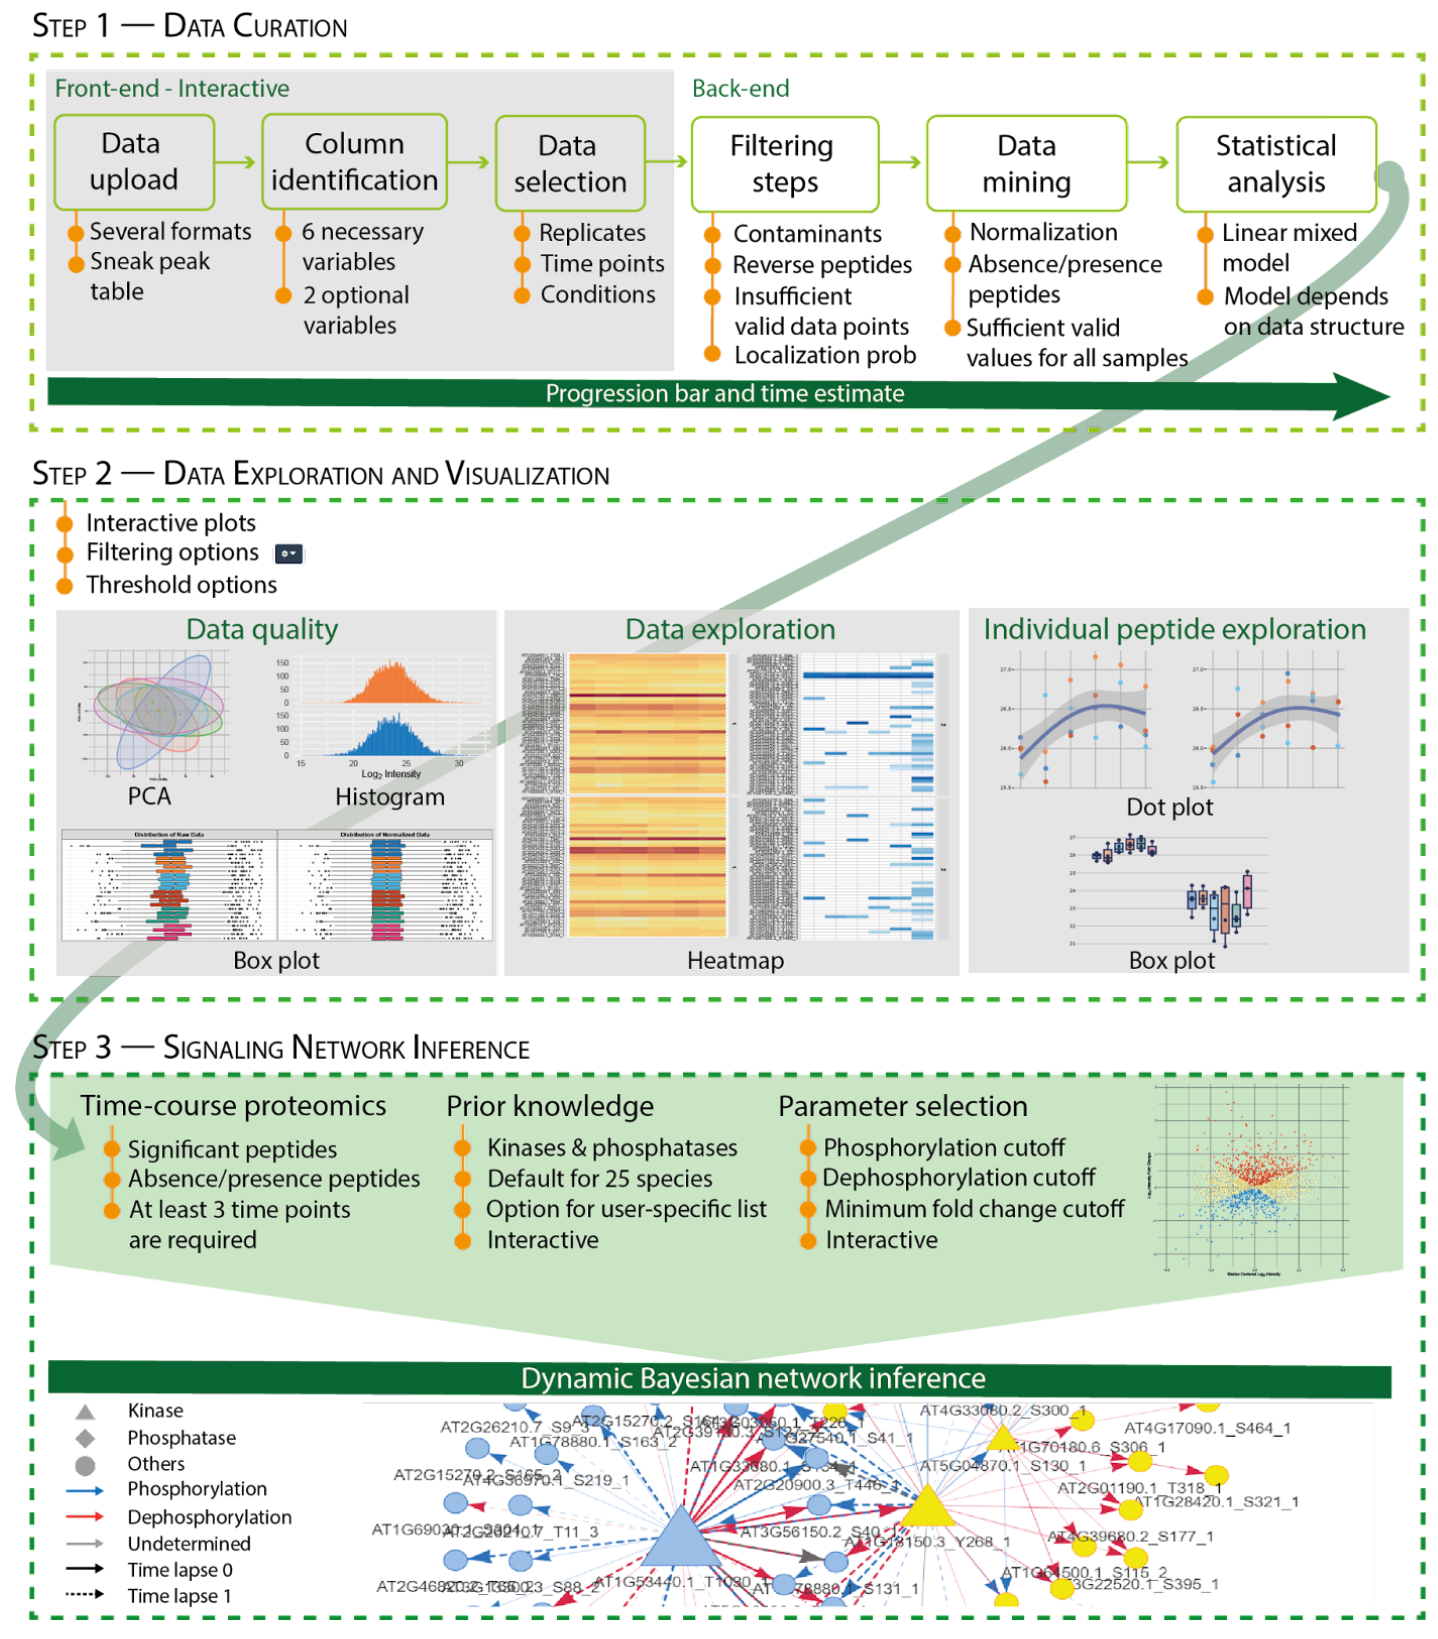
Phosphorylation of proteins can regulate their turnover and activity, and phosphorylation at different sites can facilitate distinct programs of regulations. Studying phosphorylation relays in a network is thus important to understand plant responses, however downstream analyses, including data-driven network inference, is still a bottleneck. We developed a Shiny application, NetPhorce, which serves as a portal for users who have little or none experience in coding and mathematical analysis for exploratory and in-depth analyses of phosphoproteomics data. NetPhorce offers a user-friendly interface that performs data filtering steps, quality control, statistical analysis, data visualization, and network inference. The application can be used with minimal computing and bioinformatics knowledge enabling the translation of phosphoproteomics into biological hypotheses.
Please check out the Get started for information regarding required packages for running NetPhorce Shiny Application locally.
The phosphoproteomics network analysis repository contains the following two sub-projects
- Shiny web application [link]
- R package [link]
Where to find help within the Shiny Application?
- Click the green info icon to open a separate tab showing a detailed breakdown for that section:
- Click the question mark icon to display a popup window detailing the purpose of that panel.
- The shiny application is broken down into three Steps. Step 1 is required before Step 2 or Step 3.
