Examples of the plots provided within NetPhorce
Source:vignettes/F4_Statistics_Plot_Examples.Rmd
F4_Statistics_Plot_Examples.RmdThe following examples include all the plots that can be generated at Step 2 and Step 3. All of the plots are offered as interactive and static versions with the exception of the Histogram/Boxplot and Network Plot.
Step 2 generated plots:
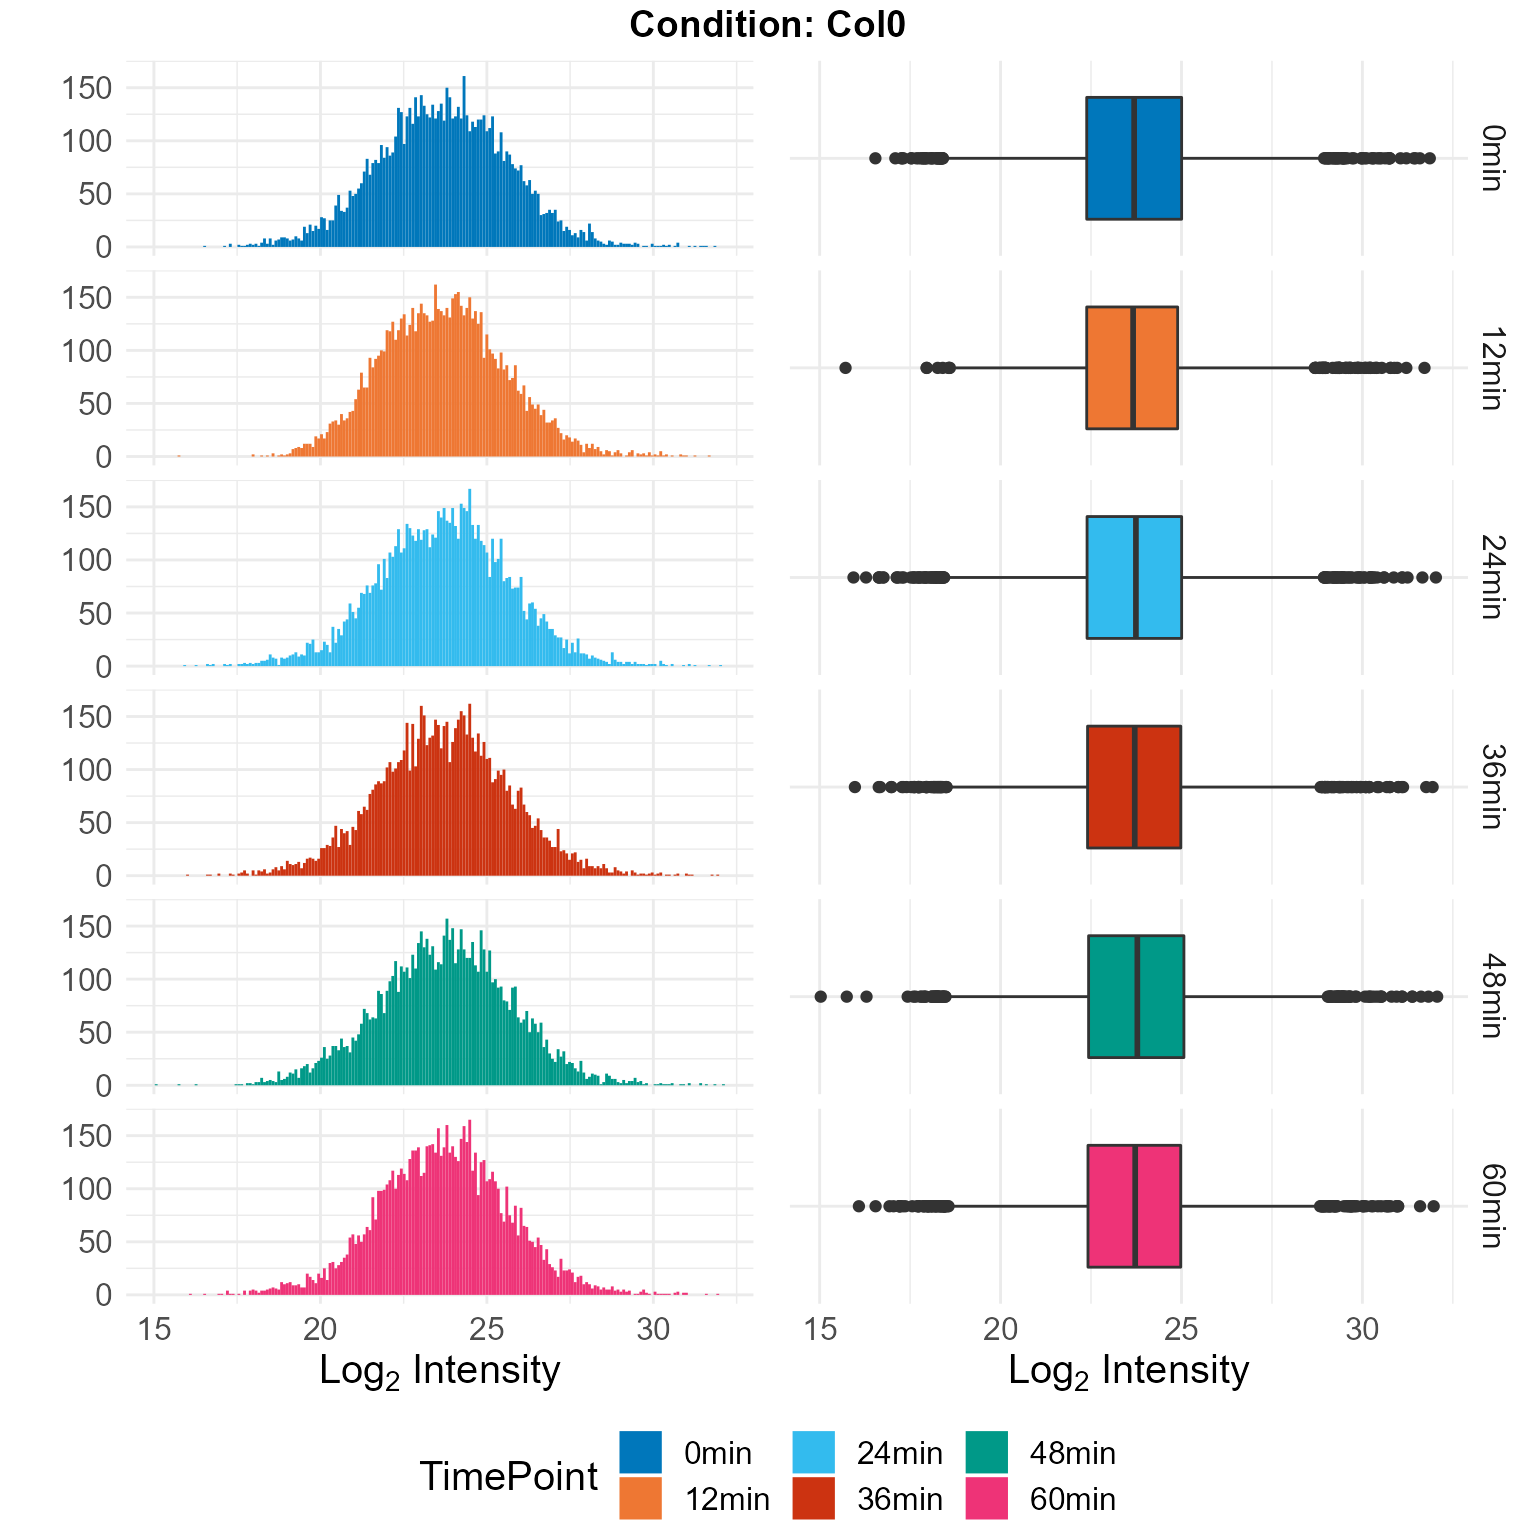
- 2.1 Distribution Plot
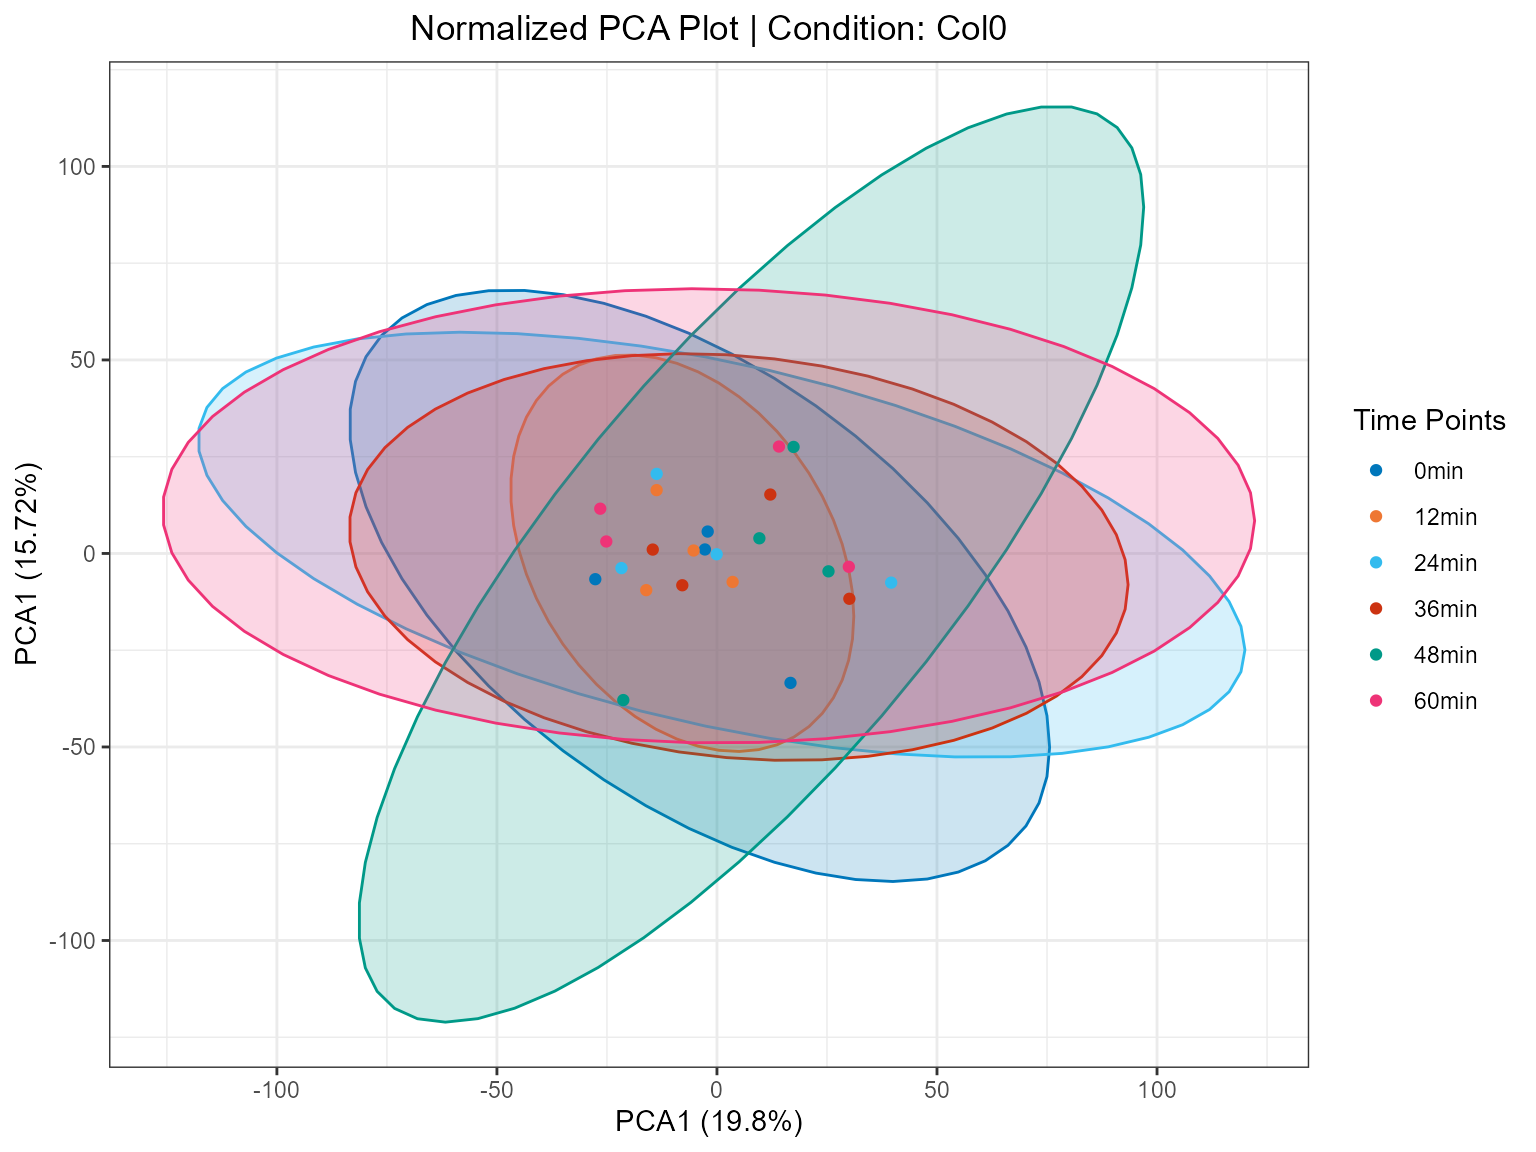
- 2.2 PCA Plot
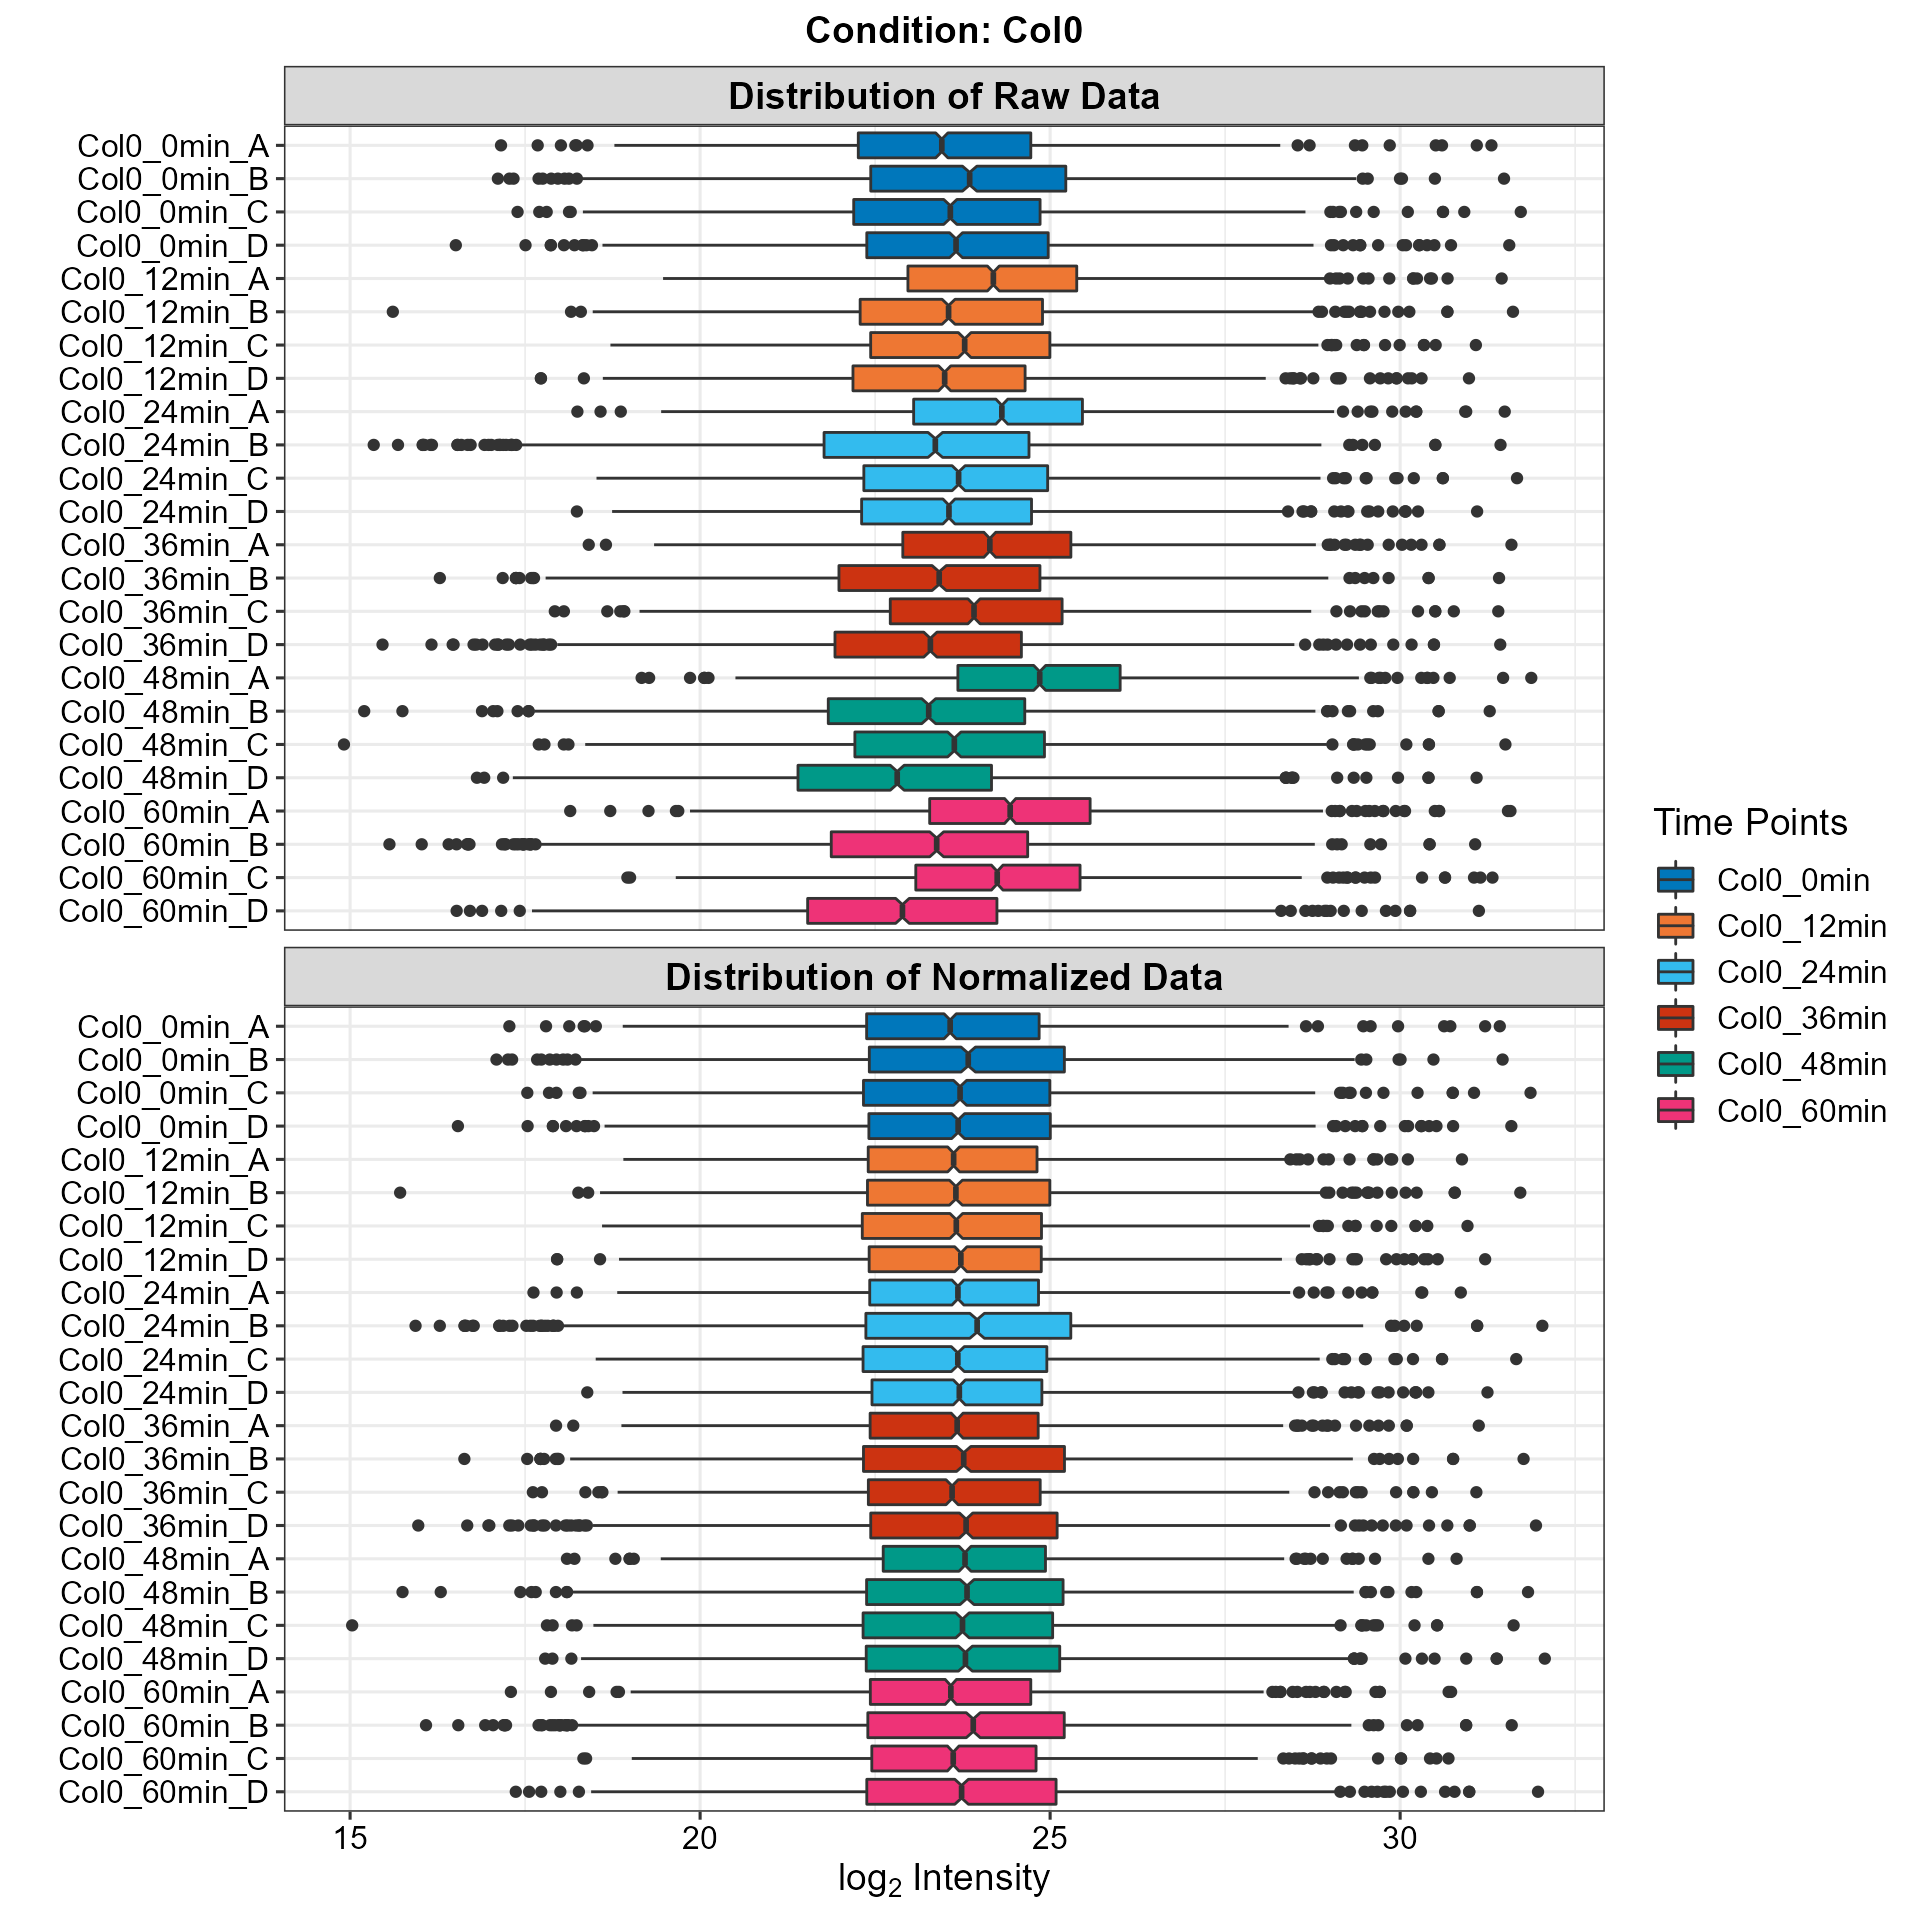
- 2.3 Histogram/Boxplot
- 2.4 Heatmap
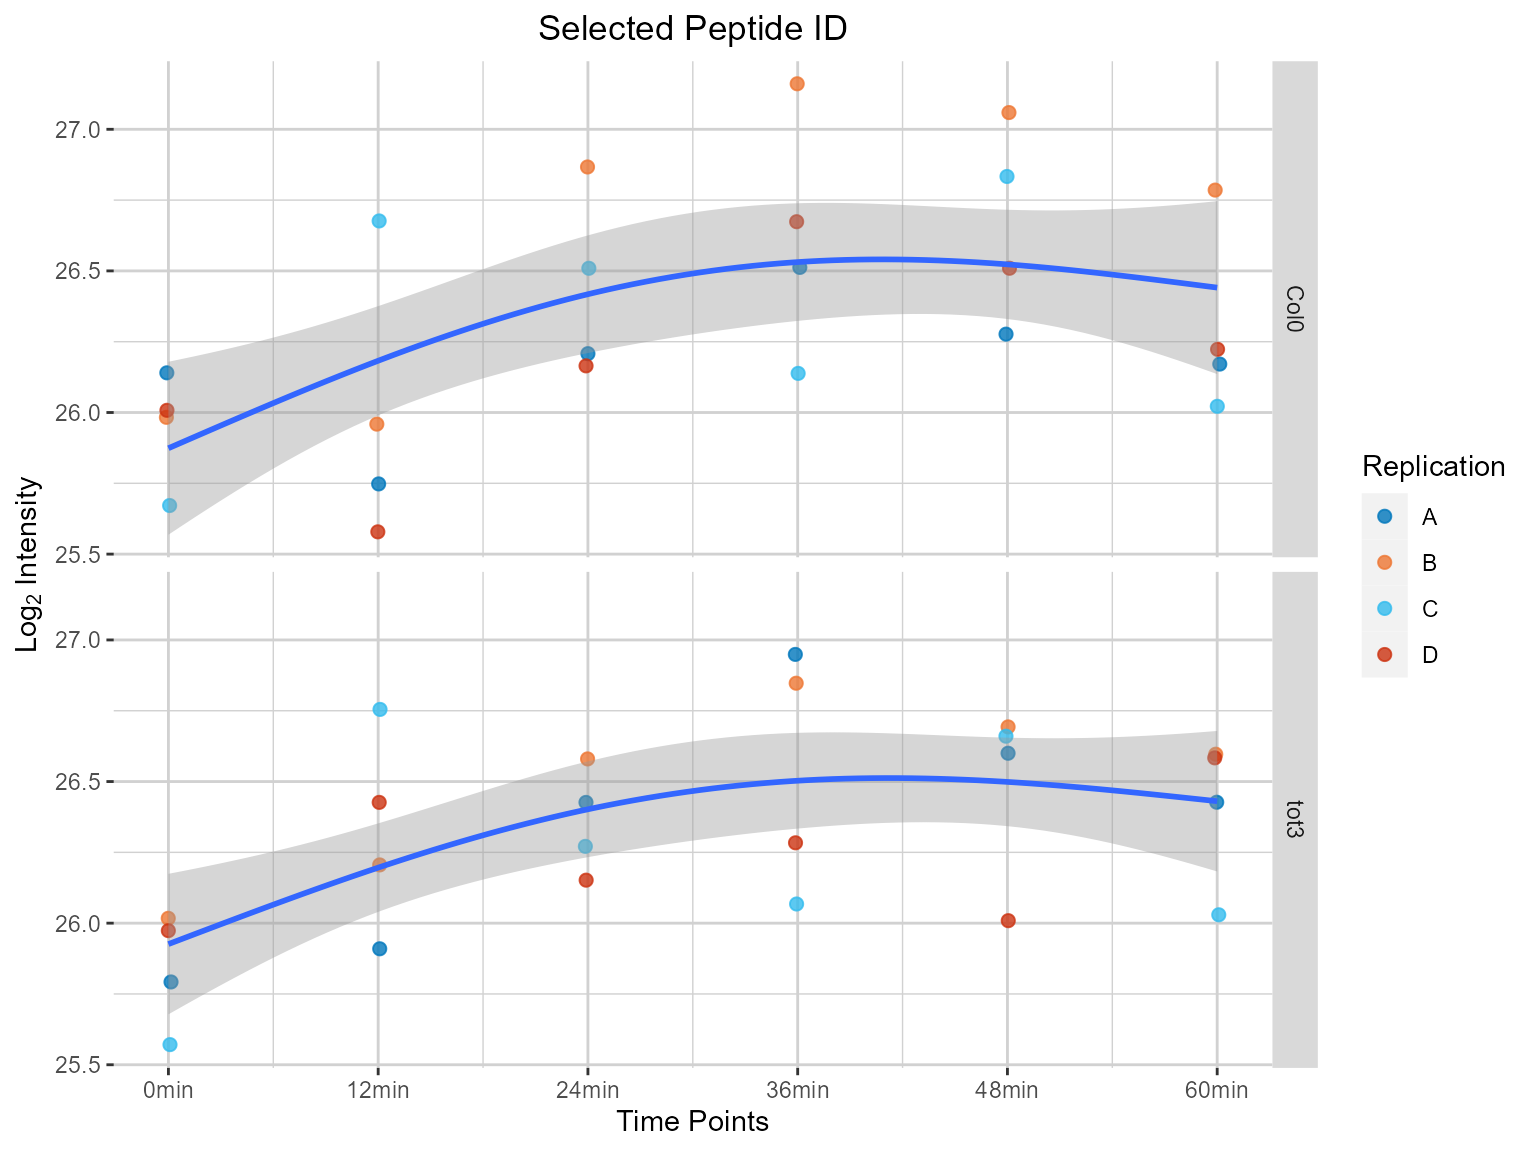
- 2.5 Individual Peptide Plot
- 2.6 Multiple Peptides Plot
Step 3 generated plots:
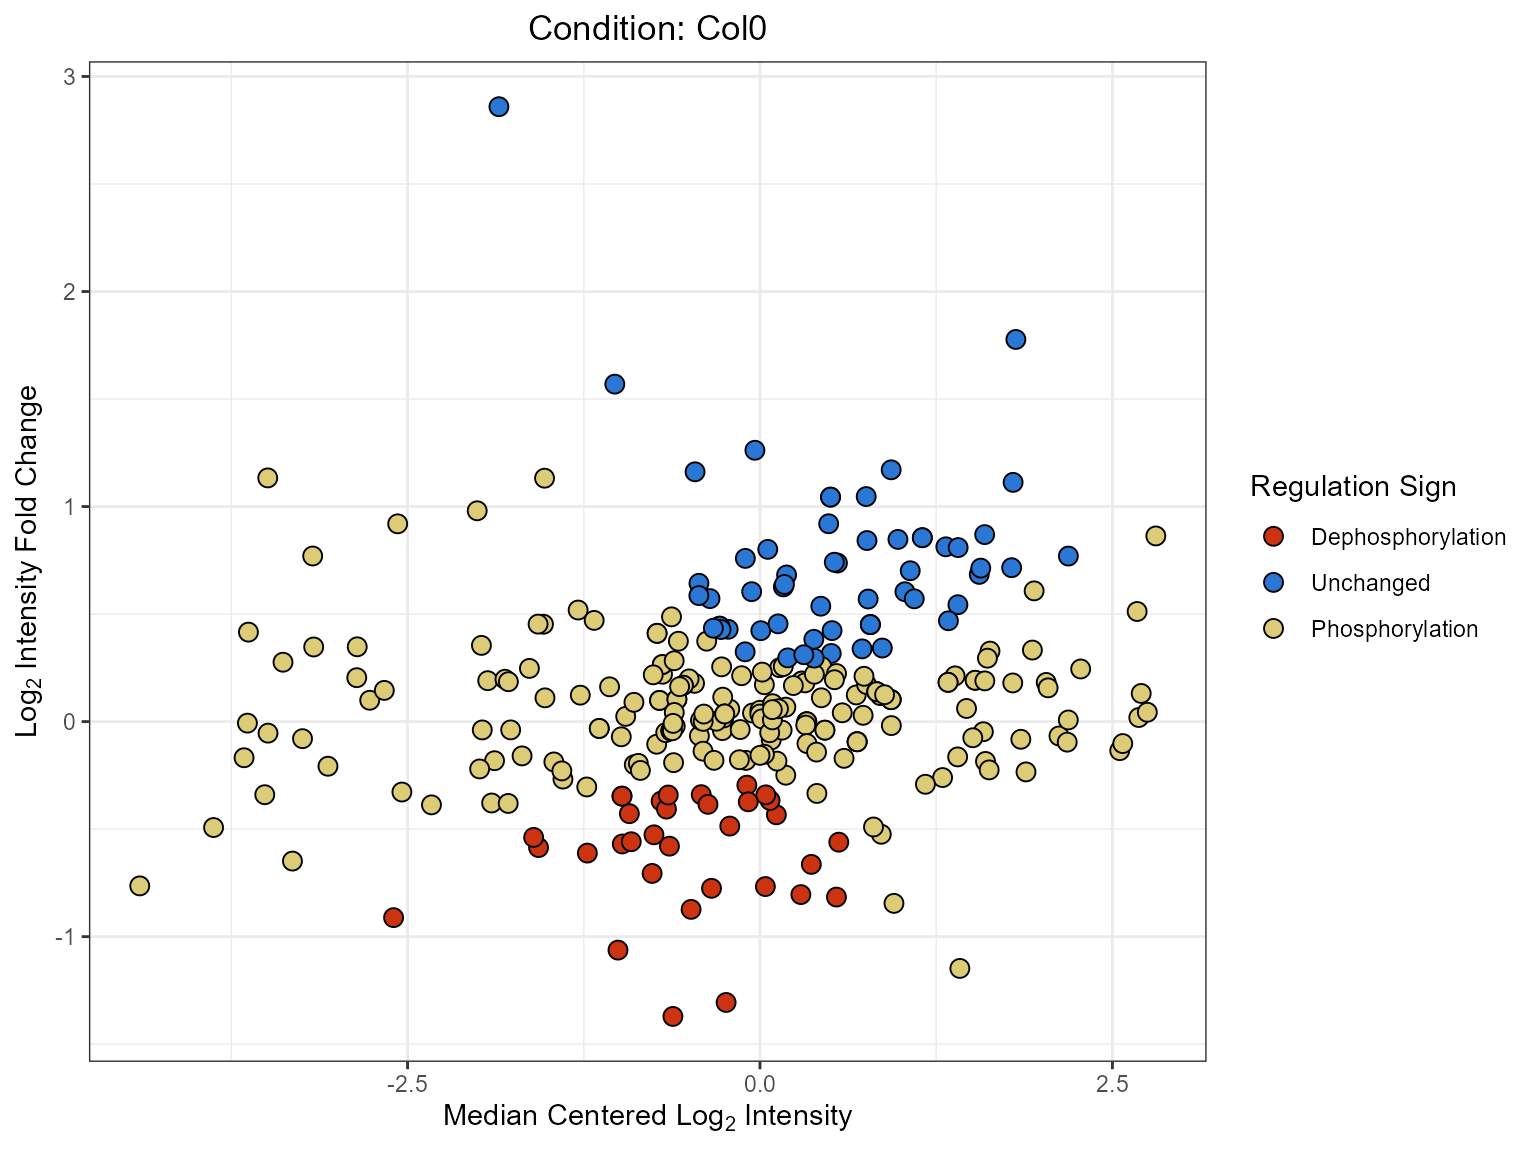
- 3.1 Regulation Plot
- 3.2 Network Plot
2.4 Heatmap
2.4.1 Static Version
#> Warning: `funs()` was deprecated in dplyr 0.8.0.
#> Please use a list of either functions or lambdas:
#>
#>   # Simple named list:
#>   list(mean = mean, median = median)
#>
#>   # Auto named with `tibble::lst()`:
#>   tibble::lst(mean, median)
#>
#>   # Using lambdas
#>   list(~ mean(., trim = .2), ~ median(., na.rm = TRUE))
#> This warning is displayed once every 8 hours.
#> Call `lifecycle::last_lifecycle_warnings()` to see where this warning was generated.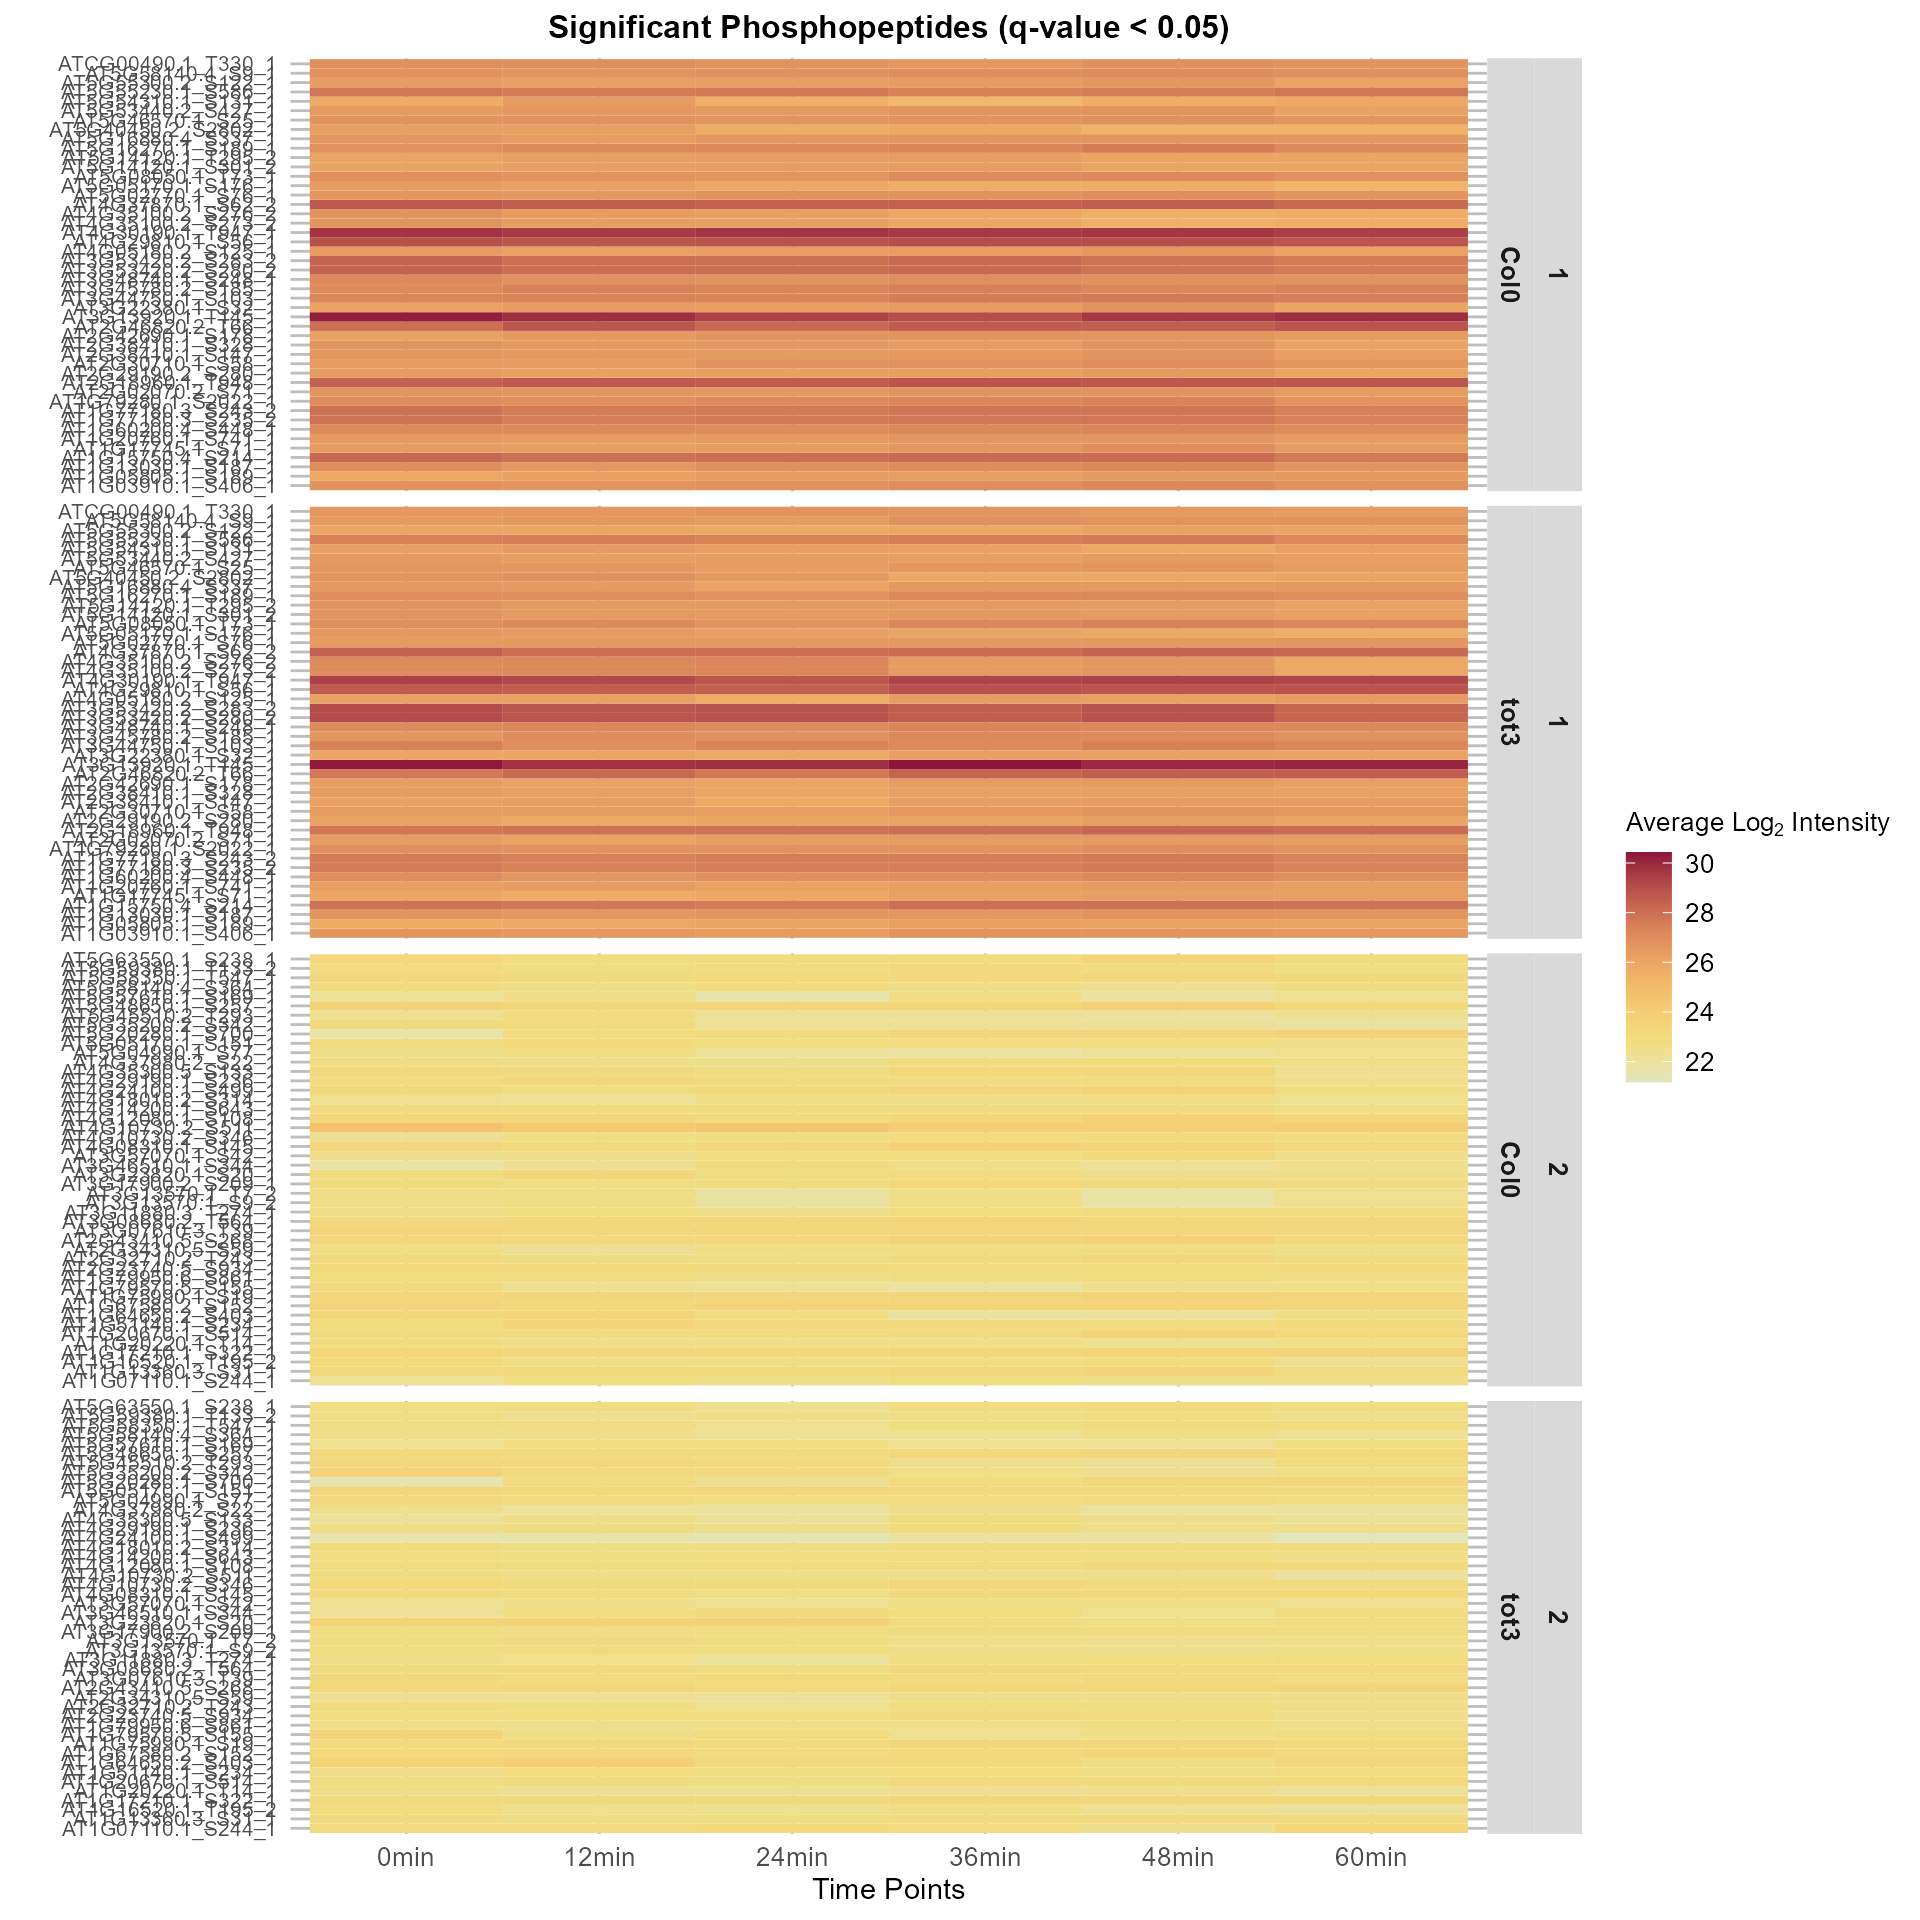
2.6 Multiple Peptides Plot
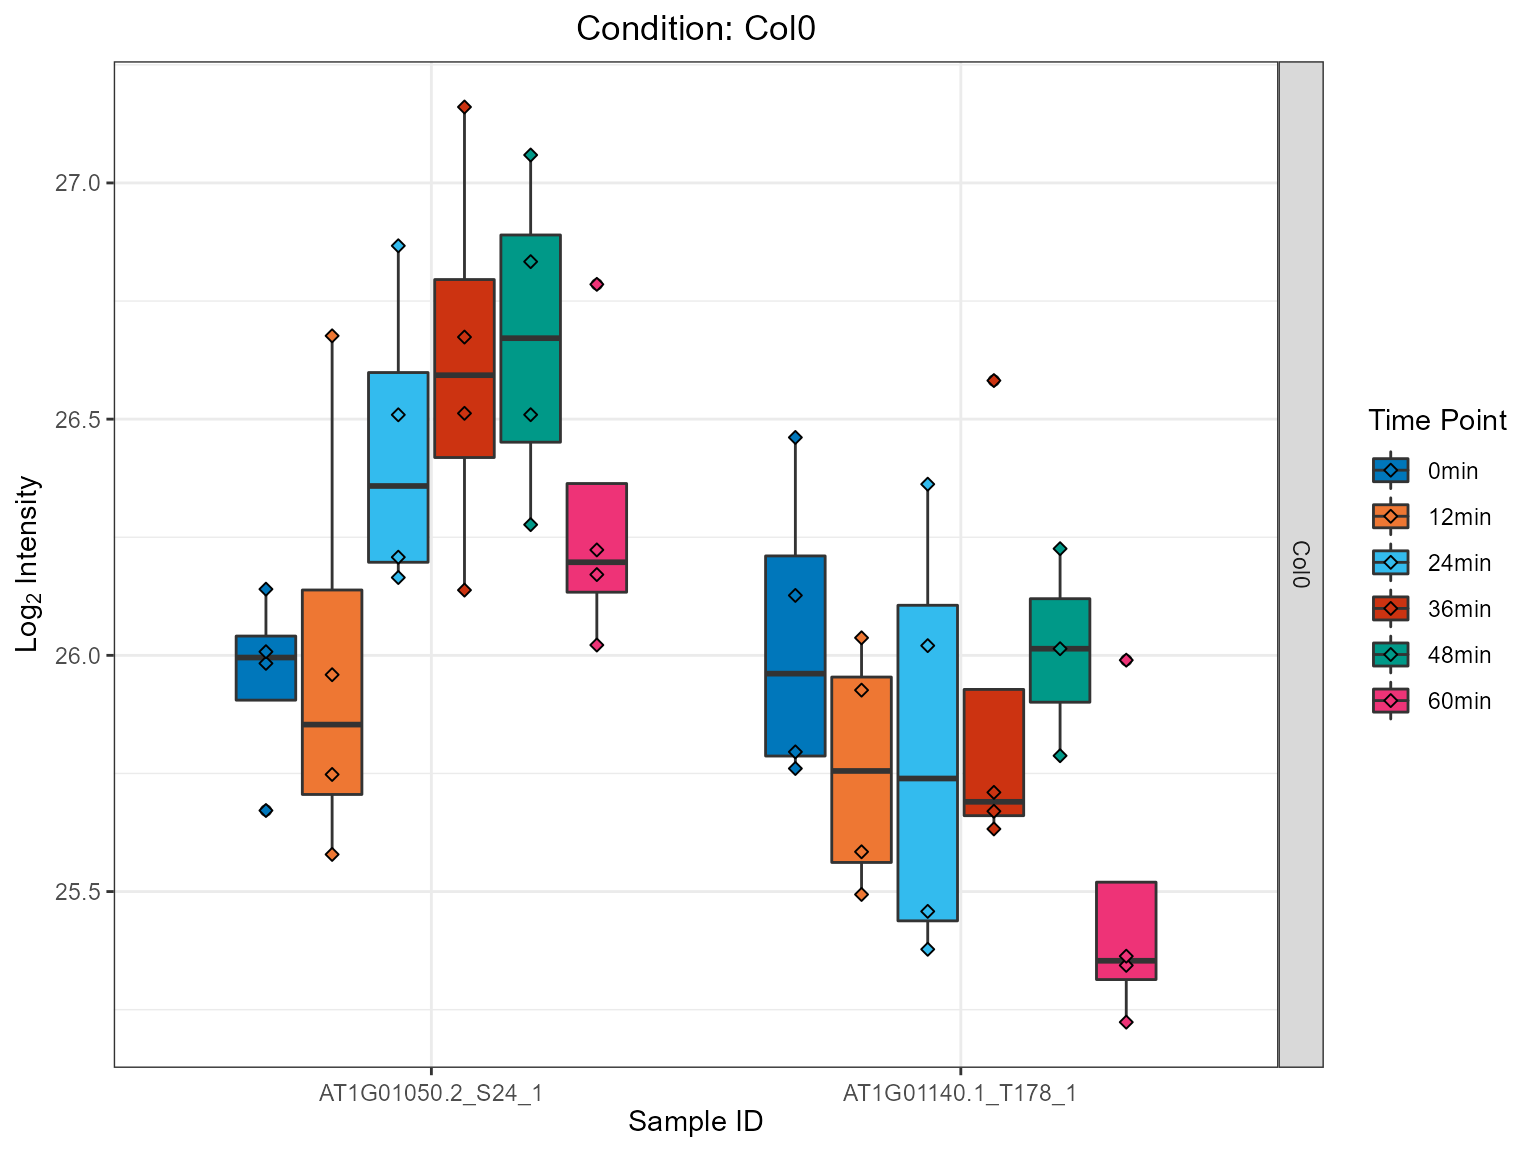
2.6.2 Interactive Version
#> Warning: 'layout' objects don't have these attributes: 'boxmode'
#> Valid attributes include:
#> '_deprecated', 'activeshape', 'annotations', 'autosize', 'autotypenumbers', 'calendar', 'clickmode', 'coloraxis', 'colorscale', 'colorway', 'computed', 'datarevision', 'dragmode', 'editrevision', 'editType', 'font', 'geo', 'grid', 'height', 'hidesources', 'hoverdistance', 'hoverlabel', 'hovermode', 'images', 'legend', 'mapbox', 'margin', 'meta', 'metasrc', 'modebar', 'newshape', 'paper_bgcolor', 'plot_bgcolor', 'polar', 'scene', 'selectdirection', 'selectionrevision', 'separators', 'shapes', 'showlegend', 'sliders', 'spikedistance', 'template', 'ternary', 'title', 'transition', 'uirevision', 'uniformtext', 'updatemenus', 'width', 'xaxis', 'yaxis', 'barmode', 'bargap', 'mapType'