Step 3 is designed to guide the user through data-driven signaling network inference. The network inference identifies causal regulation between kinases and phosphatases and their downstream targets using dynamic Bayesian principles. The Bayesian inference leverages time series data to infer whether intensity changes of a regulator are causal for the intensity changes of a target. As such, the network analysis can only be performed when a time course dataset was analyzed. Because the analysis is a probabilistic approach, the accuracy of the network analysis will increase with the number of time points and decrease with the number of phosphopeptides. As such, the analysis should not exceed the range of hundreds of peptides to be reliable. Step 3 includes the following sections:
- Section 1: Loading and Selecting of Kinases/Phosphotases
- Section 2: Regulation Filtering
- Section 3: Network Plot
Section 1: Loading and Selecting of Kinases/Phosphotases
- To increase the inference power, the network analysis relies on prior knowledge, namely the annotation of kinases and phosphatases. In this section, we identify the kinases and phosphatases within the analyzed dataset based on a user-provided list or a built-in list of 1 of 25 species. Please make sure that the protein IDs used within the kinase/phosphatase tables are identical to the protein IDs used in the dataset. When the kinases and phosphatases have been correctly identified, their numbers will be displayed in the Kinase/Phosphatase Validation Table.

Section 2: Regulation Filtering
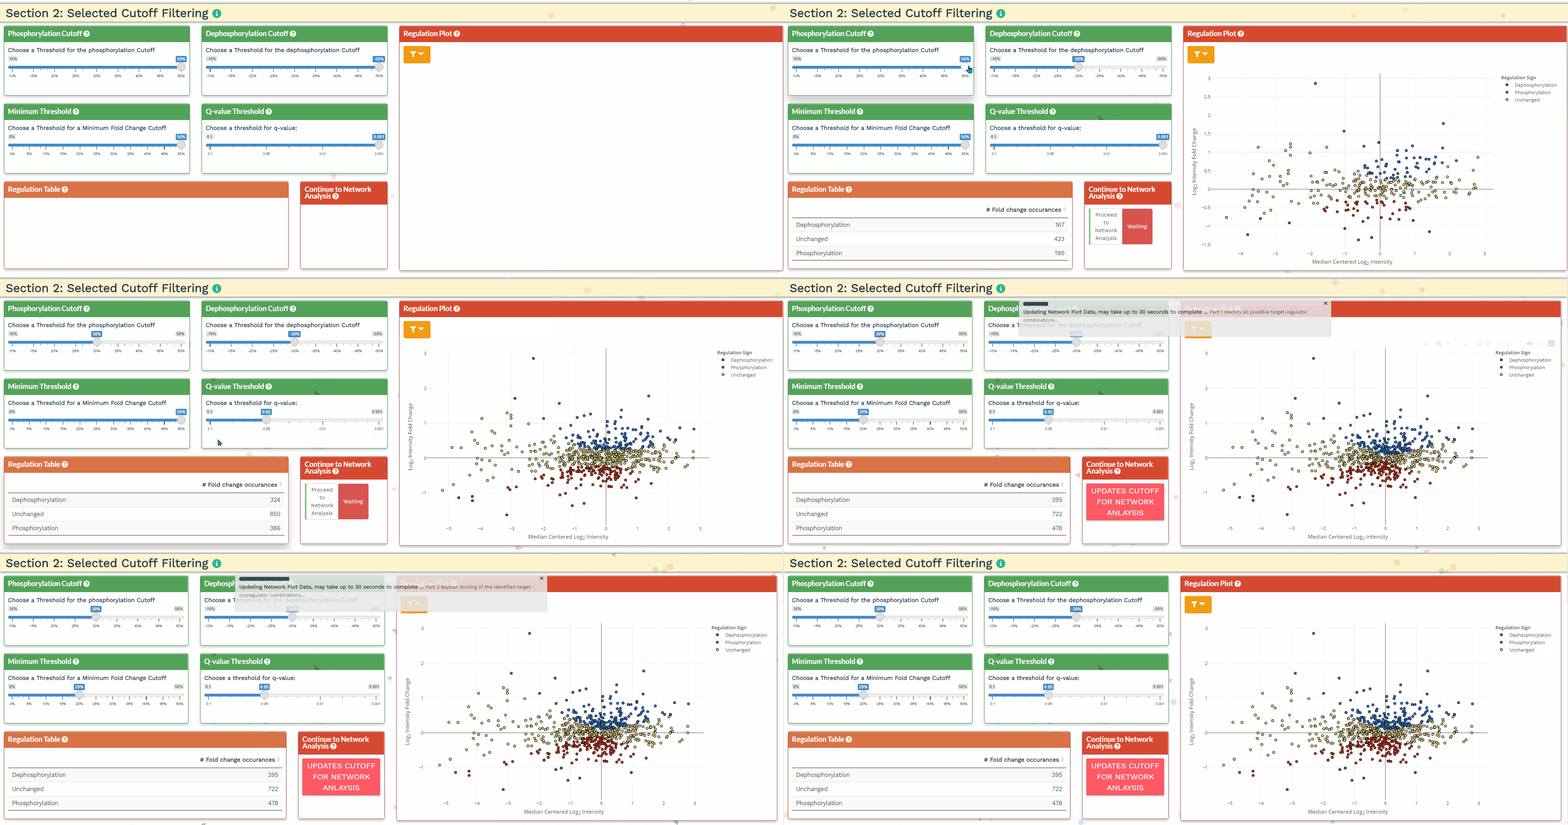
- The user can set four parameters to adjust the stringency of the network inference. The regulation plot allows for the users to visually evaluate the chosen thresholds. Increasing the stringency will decrease the number of intensity changes that will considered a change in phosphorylation, which is reflected in the regulation plot.

Section 3: Network Plot
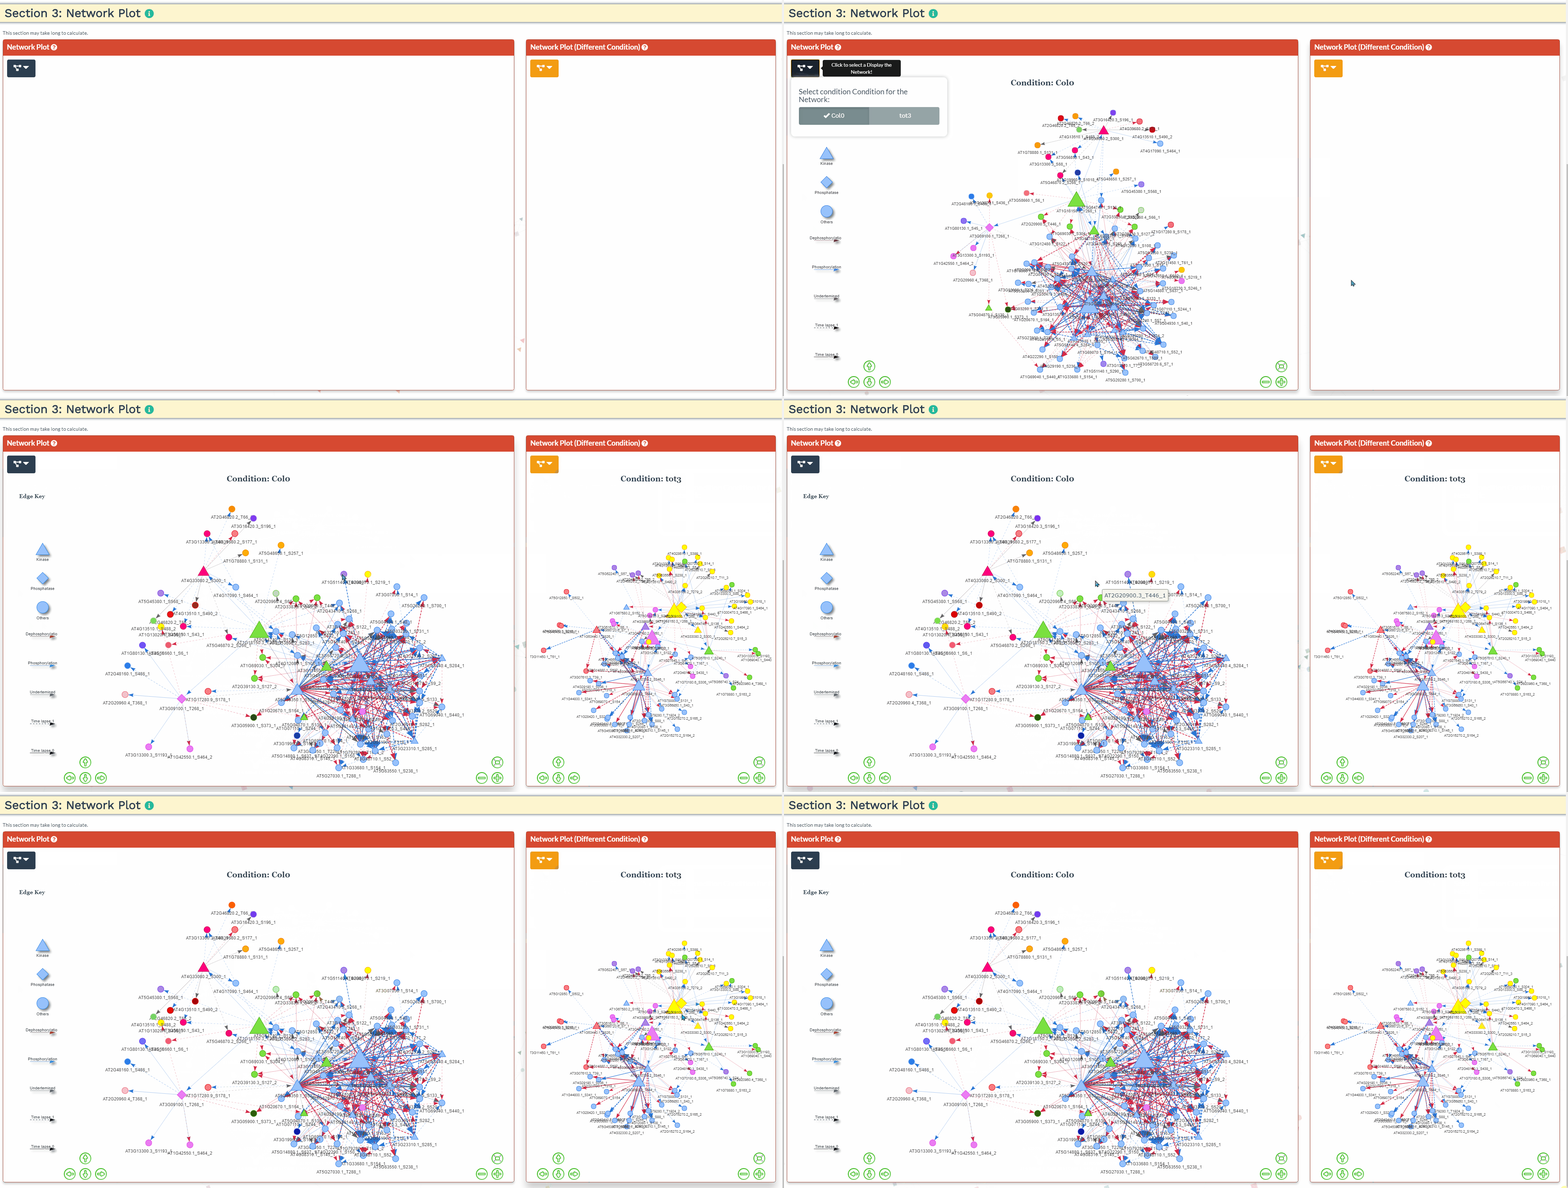
- An interactive network plot allows for easy exploration of the predicted signaling network. For more then one condition, the common phosphopeptides are used as input and a network is generated for each condition separately. As such, the network results might differ slightly when running each condition separately through NetPhorce compared to running the conditions together.
